

BIEB 100. Biostatistics. Winter 2014

General information and announcements
Welcome to the Winter 2014 web page for Biostatistics. All course material and announcements will be posted or linked here. Check out the Change Log section to see what is new.
You may use a non-programmable calculator for the final exam. There are a few questions where one might come in handy.
Final exam reviews: Saturday, March 15, 1-3PM, Center 109. | Sunday, March 16, 1-3PM, Center 109.
A large, detailed flowchart for hypothesis tests and estimation is now in the FAQ section
Links to two post-course assessments are below. You will receive credit just for taking these by Sunday, March 23.
OFFICE HOURS DURING FINALS WEEK
Brian will do Rick's office hours Monday from 10:30-11:30 in Muir Biology, Room 4135. He will also have an office hour on Tuesday, same place but from 2:30-3:30
Tom will hold his usual office hours on Monday: 1:45-2:45, Mandeville Coffee Cart
Prof. Rifkin will hold his usual office hours on Tuesday: 9:30-10:30, Muir Biology, Room 2150
- This web page is tested using Firefox on a Mac. If for some reason it is not displaying properly and you can't get the information, please try another browser.
Change Log
15 Mar
- Posted answers for homeworks and lab activities and Quiz 7.
12 Mar
- Learning objectives modified based on last two week reorganization
10 Mar
- Correlation coefficient exploration applet link added in applet section
9 Mar
- Posted 2 part video showing why the 2AB term drops out when breaking SumOfSquares_Total into SumOfSquares_Groups and SumOfSquares_Within (see FAQ section)
6 Mar
- Adjusted due dates for last week homework and quiz
5 Mar
- Posted lab activity for chapter 9 (March 6&7)
3 Mar
- Posted link to standardized statistic -> pvalue calculator in applets section
2 Mar
- Link to study about sensitivity, specificity, positive predictive value, negative predictive value in prenatal screening posted in the links section. Use this to practice your mastery of 2x2 tables.
1 Mar
- Chapter 5 homework answers posted
25 Feb
- Midterm answers posted on TED
24 Feb
- Chapter 5 homework due date changed
21 Feb
- Chapter 5 homework assignment posted
13 Feb
- Links on epidemiology posted
10 Feb
- Chapter 3 and bootstrapping solutions posted
7 Feb
- Quiz 3 (Chapter 2) answers on TED
6 Feb
- Bootstrapping FAQ posted
5 Feb
- Brian's office hours changed to Thursday, 3:30-4:30
4 Feb
- Posted bootstrapping homework for Chapter 3
3 Feb
- Chapter 2 exercise answers posted on TED
29 Jan
- Quiz 2 (Chapter 1) answers posted on TED
28 Jan
- Notes posted in FAQ from the January 27th lecture, Section 2.2
27 Jan
- Posted answers to chapter 1 book exercises in the solutions section
16 Jan
- Suneer has a new office hour location
- Posted answers to preliminaries chapter book exercises in the solutions section
12 Jan
- Posted lead study in links section
- Posted answers for homeworks and lab activities and Quiz 7.
12 Mar
- Learning objectives modified based on last two week reorganization
- Week 10 lab activity posted
10 Mar
- Correlation coefficient exploration applet link added in applet section
9 Mar
- Posted 2 part video showing why the 2AB term drops out when breaking SumOfSquares_Total into SumOfSquares_Groups and SumOfSquares_Within (see FAQ section)
- Quiz #6 answers posted on TED
6 Mar
- Adjusted due dates for last week homework and quiz
- Flowchart for statistical tests and estimation posted in FAQ section
5 Mar
- Posted lab activity for chapter 9 (March 6&7)
3 Mar
- Posted link to standardized statistic -> pvalue calculator in applets section
2 Mar
- Link to study about sensitivity, specificity, positive predictive value, negative predictive value in prenatal screening posted in the links section. Use this to practice your mastery of 2x2 tables.
1 Mar
- Chapter 5 homework answers posted
- Chapter 4 investigation answers posted
- Reorganization of last two weeks of course
25 Feb
- Midterm answers posted on TED
- Quiz 5 (Chapter 4) answers on TED
24 Feb
- Chapter 5 homework due date changed
21 Feb
- Chapter 5 homework assignment posted
13 Feb
- Links on epidemiology posted
- Quiz 4 (Chapter 3) answers on TED
10 Feb
- Chapter 3 and bootstrapping solutions posted
7 Feb
- Quiz 3 (Chapter 2) answers on TED
- Link to bootstrapping chapter in another textbook posted
6 Feb
- Bootstrapping FAQ posted
5 Feb
- Brian's office hours changed to Thursday, 3:30-4:30
4 Feb
- Posted bootstrapping homework for Chapter 3
- Adjusted due dates and arrangement of homework for Chapter 3 in order that answers can be posted before the quiz on Feb 12
3 Feb
- Chapter 2 exercise answers posted on TED
29 Jan
- Quiz 2 (Chapter 1) answers posted on TED
- Link to statistical power/error applet posted in applet section
- Chapter 1 exercise answers updated
28 Jan
- Notes posted in FAQ from the January 27th lecture, Section 2.2
27 Jan
- Posted answers to chapter 1 book exercises in the solutions section
- Lab activity for Jan 30/31 posted
16 Jan
- Suneer has a new office hour location
- Posted answers to preliminaries chapter book exercises in the solutions section
- Posted links about the Cornell ESP study in the links section
12 Jan
- Posted lead study in links section
- Posted link to Monty Hall problem simulation in links section
Syllabus
Learning objectives and lecture schedule
- Learning objectives by lecture/book section. html / txt (will open in a new window)
- Video podcasts (video will be of limited use). Audio podcasts.
Textbook
- We will be using the textbook Introduction to Statistical Investigations by Tintle et al. for this course.
The complete textbook in pdf format is on TED. Please do not distribute this pdf. You can also order a 3-hole-punched printed copy from the UCSD bookstore.
Office hours and section locations
- If you have questions about homework or lab activities, please go to a TA's office hours or arrange a meeting with your TA.
- If you have questions about a lecture or more general questions about statistics, please take advantage of the office hours of the TAs or Prof. Rifkin.
- Please put BIEB100 in the subject line of your email when sending an email to an instructor about this course.
Rick Thomas
Office hours: Mondays, 10:30-11:30
Mandeville Coffee Cart (or inside Mandeville if it is raining)
Section: Thursdays, 3, ERCA 117
Brian Hong
Office hours: Thursdays 3:30-4:30
Muir Biology, Room 4135
Sections: Thursdays, 2, ERCA 117
Suneer Verma
Office hours: Fridays, 4-5
At the tables in Muir Courtyard, just west of the classroom
Sections: Fridays, 1, 2, ERCA 117
Tom Li
Office hours: Mondays, 1:45-2:45
Mandeville Coffee Cart (or inside Mandeville if it is raining)
Sections: Thursdays, 12, 1, ERCA 117
Professor Rifkin
Office hours: Tuesdays, 9:30-10:30
Muir Biology, 2150
Course wiki
This course has a discussion board. Please use it as an interactive space to discuss the course, arrange to swap sections if needed, pose questions, post interesting statistical news, etc. Just make sure it has to do with statistics. Accounts should be active on the first day of class.
Feedback supplies
At the end of some class sessions I will ask you to spend two minutes writing down the muddiest and most interesting points from the class on an index card or a piece of paper. This feedback will tell me whether we are ready to move on to the next topic. Please bring an index card or small piece of paper to each class for this.
Data generating supplies
Class demonstrations will occasionally require tools. Please go here and print out a set of 1000 random digits from 0 to 9. (For easy printing choose 15 columns in Part 1, "Bare bones text" in Part 3, and "generate your own" in Part 4). Please also print out a set of 100 random numbers from 1 to 200. Please bring these sheets and a coin to every class. If we will need a different tool for a demonstration or for lab (e.g. dice, deck of cards, ruler, etc.) it will be posted on the website and announced in class.
Computers and phones in class and sections
Bring paper and something to write with to take notes in class. Please do not use your computers or phones or other distraction-enabled devices in class. We will use computers for some exercises in sections, but you are expected to be courteous to your fellow students and TA and use them only for the intended purposes. Phones are only to be used for emergencies and outside the classrooms.
Post-tests
POST COURSE TESTS
Below are links to two nationally standardized tests. They are useful for Prof. Rifkin and for the authors of your textbook to evaluate how much this class has changed your understanding and expectations of statistics compared to other classes and approaches to teaching statistics.
Please try your best on this so that it results in accurate information. You will receive credit merely for taking these and credit will not be based on how well you do or what you say on them. The specific answers are anonymized.
You should NOT use books, notes, web resources, or calculator on these. There is no reason to, as your grade is NOT based on your score on the test, it is only based on actually TAKING this test. Please, however, try to do as well as possible.
- On the first page you will enter some basic information about yourself, you will then go onto to answer the questions. Most students take 15-40 minutes to answer the questions. Calculators are not needed for these tests.
- You will receive credit for these if you complete them by Sunday, March 23.
- On the last page of questions you will click “Done” to submit your responses
- Test of statistical knowledge - Test of attitudes towards statistics
Applets
- Exploring correlations and scatterplots
- Guessing correlations applet (you need to have java working for this one)
- Standardized statistic -> p-value calculator for various theory-based distributions
- Another calculator with a few more distributions
- Additional applets from StatKey for confidence interval estimation and their instructions
- There are also some short videos here that explain how to use these StatKey applets
- Type I, Type II errors and power applet. This applet lets you experiment with alternative and null distributions as shown in class on Wednesday, Jan 29th (Section 2.3). To start, just change how far away the alternative mean is (mu1). Or change the sample size (n). Or change the significance cutoff (alpha). Alpha is the Type I error rate. Beta is the Type II error rate. Note that Power = 1 - beta. To see why look at the tables we discussed in class.
- Statistical applets described in the textbook (tablet users may want to click here)
- Note that these applets are perfectly good for doing statistical tests in other classes or in your current or future research.
Datasets
- Galton's height data for regression lab
- Datasets used in the textbook, exercises, and investigations
Relevant links to news stories, commentaries, studies
If you want to learn R (the preeminent statistical software package and free!)...
- This site looks very good.
Chapter 4 is about causation. Here are some great short pieces about what we can learn from nutritional studies (including one from UCSD) that give great examples about confounding
Should you eat chocolate? (from UCSD!)
Xigris
- On the controversy over Xigris approval and treatment. Also here from the New England Journal of Medicine (the top academic medical journal).
Sensitivity, specificity, positive predictive value and medical tests
- A new DNA sequencing based test for fetal chromosomal abnormalities performs better than standard screening.
ESP!
- A news article about followups to the study. See also here for the original report from this source.
- PDF of the lead study discussed on 8 Jan 14
- This site looks very good.
- A search result list of learning R resources
- Download R from here. It is also on the computers in the York labs.
- R Studio programming environment. I would highly recommend you use this for running R.
Chapter 4 is about causation. Here are some great short pieces about what we can learn from nutritional studies (including one from UCSD) that give great examples about confounding
Should you eat chocolate? (from UCSD!)
- The original study
- UCSD press release
- The New York Times likes it
- Chocolate & Red Meat Can Be Bad for Your Science: Why Many Nutrition Studies Are All Wrong (If you read just one of these, read this one)
How about red meat?
- The original study
- The BBC is onboard as is the New York Times
- Not everyone agrees that this study tells us very much
- Critique of journalism on this study. Best quote:
If you’ve been hanging around the nutrition world for very long, you’ve probably realized by now that health according to the media and health according to reality are two very different things—and even scientific studies can be misrepresented by the researchers who conduct them.
Coffee?
- The original study
- Crowdsourcing scientific critiques: What's Wrong With the Coffee Mortality Study? You Tell Us
- Typical rather uncritical media headline with caveats buried deep in the article
- Atypically skeptical media report
More general discussions of human observational epidemiology studies and association vs. causation
- A short primer for reporters on how to critically read and write about scientific studies involving humans
- A media critique of media coverage of observational nutritional studies
- Do we really know what makes us healthy?
- Epidemiology faces its limits (Really gets at the issues were are wrestling with in Chapter 4)
- An excellent critique focusing on the Nurses' Health Study. Lots of great details about how they do their surveys - good fodder for skepticism.
UCSD's own Elizabeth Barrett Connor is quoted:
The investigators for the Nurses’ Health Study “tend to believe everything they find,” says Barrett-Connor of the University of California, San Diego. Barrett-Connor also studied hormone use and heart disease among a large group of women and observed and published the same association that the Nurses’ Health Study did. She simply does not find the causal explanation as easy to accept, considering the plausibility of the alternatives. The latest variation on the therapeutic wisdom on H.R.T. is plausible, she says, but it remains untested. “Now we’re back to the place where we’re stuck with observational epidemiology,” she adds. “I’m back to the place where I doubt everything.”
Xigris
- On the controversy over Xigris approval and treatment. Also here from the New England Journal of Medicine (the top academic medical journal).
- A blog post with relevant links about the approval, experiments, and withdrawal. Note that it was pulled from the market in 2011 so there was a longer delay between Mr. Eisner's episode and the drug's withdrawal than the article said.
- The article (from which the quiz was taken) was published now because there was a review of 150 studies that was published recently that shows that mice are not good model organisms for testing drugs for some diseases. Sepsis is one of these diseases. Apparently, mice do not respond to sepsis, burns, and trauma the same way humans do. One thing that is surprising about this is that it is surprising - it goes against a very ingrained and apparently unquestioned until now assumption in drug development and medicine. Drug companies often have to show efficacy of their drugs in model organisms before getting approval to do tests on humans. But mice are not humans and it isn't hard to come up with evolutionary hypotheses for why they shouldn't behave like humans. It is harder to come up with evolutionary reasons why they should behave like humans. And yet, the default (null) has been to assume that they are similar enough instead of having to justify that they are similar enough. So the article you read was actually a spin-off article from the NY Times article reporting on this study. What is still unclear is how they found Mr. Eisner and how many sepsis patients they went through before they found one who fit their story.
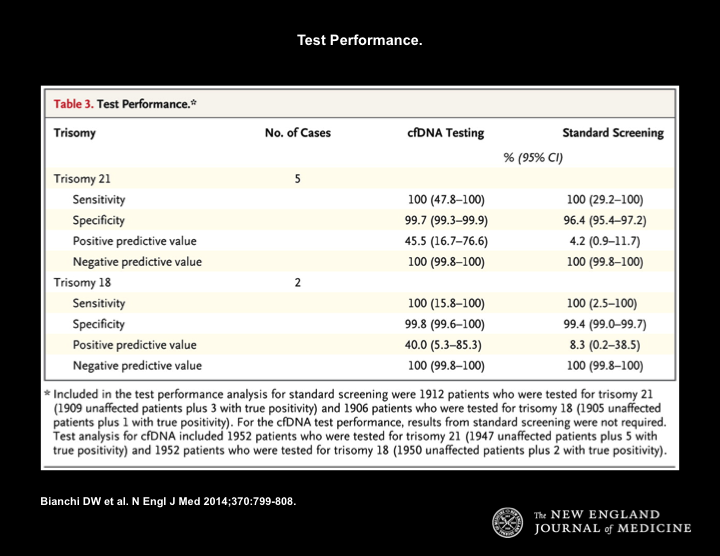
Sensitivity, specificity, positive predictive value and medical tests
- A new DNA sequencing based test for fetal chromosomal abnormalities performs better than standard screening.
One key experimental design consideration was to have a study sample that was representative of the general obstetrical population in the US:
Although these findings are encouraging, the cited studies examined narrowly defined populations and screening algorithms that do not represent the more complex and variable approaches currently used in the United States. Recently, there have been multiple appeals for evidence concerning the performance characteristics of cfDNA testing and its clinical usefulness in the general obstetric population.16,17 Here, we describe the results of the Comparison of Aneuploidy Risk Evaluations (CARE) study, a prospective, blinded, multicenter observational study comparing the results of noninvasive prenatal cfDNA testing for fetal autosomal aneuploidy with the results of conventional screening for trisomy 21 (Down's syndrome) and trisomy 18 (Edwards' syndrome) in a general obstetrical population, with outcomes included.
- This explicit focus on being able generalize led to news headlines like this one: New study suggests prenatal genetic tests could be offered to all pregnant women
- Table 3 from the journal article has all the information about outcomes that you would need to fill in all cells in a 2x2 table with counts, which are more readily interpretable than percentages.
Note the ranges of the different confidence intervals.
ESP!
- A news article about followups to the study. See also here for the original report from this source.
- A puff piece from Cornell about the study
- A close look at the study including a short pertinent background on some relevant historical papers in parapsychology
- A nice example of why it would be nice (and, on more dire issues, essential) to have more statistical literacy among journalists. On factual issues, not all opinions are equally valid.
- Compare this to this. Quite different presentations from CBS and ABC
- And the paper itself
- PDF of the lead study discussed on 8 Jan 14
- Monty Hall problem (from Math 187)
FAQs
- 2 part video explaining how to get the formula SumOfSquares_Total = SumOfSquares_Groups + SumOfSquares_Within (~8 minutes total) | Part 1 | Part 2
- Flowchart for statistical tests and estimation | pdf | jpeg | png
- Boostrapping
- On p-values, significance levels, and error
- Notes from lecture on Section 2.2 (Jan 27th)
- 1-sided vs. 2-sided tests
Solutions to quizzes, homework problems, and investigations
Solutions to Assigned Exercises
- Chapter 10
Investigation solutions
- Memorizing letters activity
Quiz solutions
- Chapters 9 & 10.1
Midterm Answers
- Chapter 10
- Chapter 9
- Chapter 6
- Chapter 5
- Exploration 4.3
- Chapter 4
- Chapter 3
- Bootstrapping problems
- Chapter 2
- Chapter 1
- Preliminaries Chapter
Investigation solutions
- Memorizing letters activity
- Chapter 5 investigation
- Chapter 4 investigation
- Chapter 1 investigation (lab week 3)
Quiz solutions
- Chapters 9 & 10.1
- Chapters 5&6
- Chapter 4
- Chapter 3
- Chapter 2
- Chapter 1
- Preliminaries Chapter
Midterm Answers
Homework, quiz schedule, exam schedule, and section activity list
Weekly homework will be the listed problems from the book and lab reports (usually answers to the 'Investigations').
Selected book problems will be graded based on whether they are correct or not. Lab reports will also be graded.
Below, the individual homeworks have different total numbers of points. At the end of the course each homework will be scaled appropriately so that each is worth the same percentage of your grade
Datasets referred to in the Investigations and Exercises can be found here. Applets can be found here. Quizzes will be 3-4 questions and will last 10-15 minutes at the start of class.
The schedule below may change depending on how the course progresses. Please check regularly.
|
Week of Jan 6 Lectures - Jan 8. Chapter P.2 - Jan 10. Chapter P.3 |
|
Week of Jan 13 Lectures - Jan 15. Chapter 1.2 - Jan 17. Chapter 1.3 - No activity due from the previous week |
|
Week of Jan 20 Lectures - Jan 22. Chapter 1.5 - Jan 24. Chapter 2.1 - No activity due from the previous week |
|
Week of Jan 27 Lectures - Jan 29. Chapter 2.3 - Jan 31. Chapter 3.1 - Previous week's activity due |
|
Week of Feb 3 Lectures - Feb 5. Chapters 3.3, 3.4 - Feb 7. Bootstrapping |
|
Week of Feb 10 Lectures - Feb 12. Chapter 4.1 - Feb 14. Midterm - Handout with exercises on bootstrapping - There is an explanation of boostrapping in the FAQ section and a link to the bootstrapping applets in the Applet section. Experimenting with the applet is probably way to get an idea of what bootstrapping is doing. - You can also find a chapter on bootstrapping from another intro statistics textbook here - Previous week's activity due |
|
Week of Feb 17 Lectures - Feb 19. Chapter 4.2 - Feb 21. Chapter 5.1-5.2 - Assigned: Exploration 4.3 in the textbook |
|
Week of Feb 24 Lectures - Feb 26. Chapter 5.3 and other topics on 2x2 tables - Feb 28. Chapter 6.1-2 - Previous week's activity due |
|
Week of Mar 3 Lectures - Mar 5. Chapter 9.1-9.2 - Mar 7. Chapter 9.1-2 Data for 6.CE.1 bootstrapping here. Data for 6.CE.4 randomization and bootstrapping here. 6.1.6 (a-e, 2 pts each) 6.2.5 (a-l, 2 pts each. In addition, use the bootstrapping applet to generate a confidence interval for the size of the anchoring effect. Include a screenshot. 3 pts) 6.3.4 (a-m, 2 pts each) 6.3.5 (c,d,f, 2 pts each) 6.CE.1 (a-e, 2 pts each. Also use the bootstrapping applet to generate the CI and include a screenshot. The data to paste into the bootstrapping applet is here.) 6.CE.4 (a-i, 2 pts each. For (e) and (f) use randomization and bootstrapping instead of a theory-based approach to do the hypothesis testing and generate a CI. The data to paste into the applets is here) - Previous week's activity due |
|
Week of Mar 10 Lectures
- Mar 10. Chapter 10.1-10.2
Homework: Due in class Mar 12 |
|
Week of Mar 17
- Mar 19. Final exam, 3-6 PM, cumulative. Location: Rec Gym
|
