 |
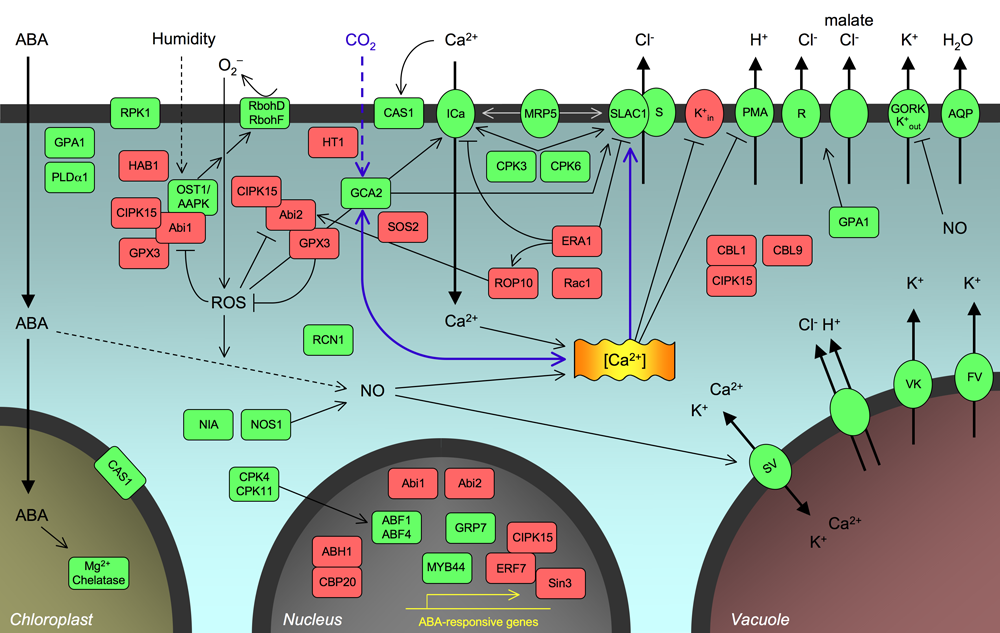
| Figure 3. ABA signaling pathways in guard cells. Positive regulators of ABA signaling are shown in green, negative regulators in red. The convergence between ABA signaling and CO2 signaling is approximated in blue (for details, see (Israelsson et al., 2006)). Pointed arrows, activation; blunt arrows, inhibition; filled arrows indicate substrate transport across membranes. Note that the illustrated interactions and locations correspond in many cases to physiological and genetic signal transduction data, and further cell biological and protein-protein interaction analyses are needed to characterize protein interactions. Arrows have not been added to all experimentally examined links in this simplified model; further links are discussed throughout the text and the publications. |