Accuracy in
Data Collection:
Timing of
Daily Bee Flight Patterns
By Dylan Voeller and James Nieh
I. Principles introduced in this exercise
A. Importance
of weather conditions in bee foraging
B. Data
collection using the web
C. Statistical
analysis: arithmetic mean
II. Introduction
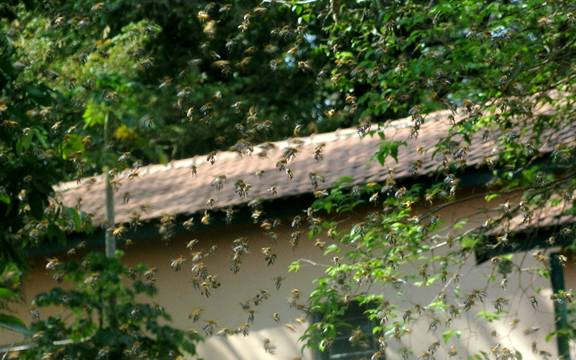
The activity of bees is
not constant throughout the day. Changes
in weather (rainy days, cloudy days, sunny days, etc), have an important effect
on their flight activity and therefore on pollination on any given day (Roubik, 1989). Many flowers provide the most nectar at
certain periods of time and thus changes in weather can affect how flowers are
pollinated, and how far bees are willing to fly to pollinate flowers.
Consequently, changes in temperature such as those occurring due to global
warming, may have an effect on the pollinating activity of bees, and thus have
larger ecological effects. This exercise
involves using a single variable, the number of bees, to determine the
temperature and time period during which a certain species of bee is most
active. It also looks at the accuracy of
data collection by comparing counts of bees between students.
III. Materials & Methods
·
Have students
click on the link above to access the video data (you will need the Quicktime
Player plugin).
There are several different video files for different species at
different times of day. We will be
adding a real-time webcam, but for now will be adding
interesting pre-recorded videos as they become available.
·
Allow
students to practice recording counts of bees flying out of the hive. Using a pen and paper, have each student
create tally marks on a sheet of paper for each bee observed in a one-minute
interval.
·
Once they are
familiar with counting using the video data, have students begin counting bees
for the entire length of the video. When
the video is finished, have each student report a total for their bee tally.
·
Be sure to
take note of the temperature, time of day, species, and location recorded in
the video.
·
Repeat this
procedure and for the remainder of the video files.
IV. Sample Results
A.
Create a table
of bee counts for each species with the different times of day and temperatures
the counts took place:
Sample Table 1: Number of bees sp. observed at various times and their corresponding temperatures
|
Number of Bees Reported by Each Group |
|
|
|
Observation Time and Temperature (°F) |
|
|
|
|
|
9:00 AM |
10:00 AM |
11:00 AM |
12:00 PM |
1:00 PM |
2:00 PM |
3:00 PM |
|
|
60 °F |
63 °F |
66 °F |
70 °F |
71 °F |
72 °F |
68 °F |
|
1 |
17 |
23 |
27 |
33 |
35 |
38 |
32 |
|
2 |
17 |
22 |
26 |
33 |
34 |
36 |
33 |
|
3 |
16 |
23 |
27 |
33 |
35 |
38 |
32 |
|
4 |
17 |
21 |
27 |
34 |
33 |
38 |
33 |
|
5 |
15 |
19 |
27 |
32 |
34 |
36 |
33 |
|
6 |
18 |
22 |
27 |
32 |
35 |
37 |
31 |
|
7 |
17 |
22 |
28 |
31 |
36 |
37 |
31 |
|
8 |
15 |
21 |
29 |
33 |
32 |
35 |
31 |
|
9 |
15 |
23 |
27 |
33 |
33 |
37 |
31 |
|
10 |
17 |
19 |
26 |
34 |
35 |
37 |
33 |
|
11 |
16 |
21 |
27 |
31 |
35 |
38 |
32 |
|
12 |
18 |
23 |
27 |
32 |
35 |
38 |
32 |
|
13 |
17 |
21 |
28 |
31 |
36 |
36 |
31 |
Analyzing the Data
Notice that in each
column of Sample Table 1, individual measurements differ from one another, but
tend to cluster around a certain value.
This value is called the arithmetic mean or average. Finding the mean of a group of measurements
can help biologists discover patterns in what seems like variable
activity. The mean can be found by
adding up the individual group counts (x1, x2, x3, . . ., xn) and dividing by the total number of groups for
which a count was taken, n.
Mean = ∑x
_______
n
For example, the mean of
column 1 (
Mean =17 + 17 + 16 + 17 + 15 + 18 + 17 + 15 + 15 + 17 + 16 + 18 + 17 ÷ 13= 215 ÷ 13 =16.54
B.
Have students
take the arithmetic mean of the group counts for each time interval.
C.
Then have
students create a graph, plotting the time of day and temperature on the
x-axis, and the mean number of bees on the y-axis:
D. Repeat steps B. and C. for each bee species.
Sample Figure 1: Mean number of bees counted as a function of the
temperature at a given time of day
V. Sample Discussion Questions
A.
What time of day
were the bees most active?
B.
At what
temperature do the bees appear to be most active?
C.
Why might the
bees be most active at this time of day?
D.
What other
factors could be influencing the activity of these bees?
E.
If global
warming raises the temperature of the earth by several degrees, how might the
activity of bees and the reproduction of the plants they pollinate be affected?
VI. Sample Conclusions
The bees were most active
at
VII. References
Hampton, R.E., 1994. Introductory biological statistics.
Inc.
Roubik, D.W., 1989. Ecology
and natural history of tropical bees.
University
Press, 514.